A Cross-Sectional Study on the Use of Computed Tomography Scan for Diagnosing Renal Masses in Pakistani Adults
Naushaba Malik1, Shahbakht Aftab2, Rida Noor2
1Department of Radiology, Rawal Institute of Health Sciences and PESSI Hospital, Islamabad; 2Department of Radiology, Pakistan Institute of Medical Sciences, Islamabad
Objective: The aim of this study is to assess the validity of Computed Tomography (CT) in evaluating solid renal masses by comparing CT findings with histopathological results.
Methodology: This cross-sectional study involved 210 patients at the Department of Radiology, PESSI Hospital Islamabad, spanning July 2022 to June 2023. Each patient underwent both non-contrast and contrast CT scans, and the radiological diagnoses were confirmed. The CT-based diagnoses were then compared with histopathological results, and measures such as positive predictive value (PPV), accuracy, sensitivity, specificity, and negative predictive value (NPV) of CT in diagnosing renal masses were calculated.
Results: The mean age of the study participants was 48.00±810 years. Male to female ratio was 2:1. The majority of the study participants were belonging from the urban area and were under graduate. The results of the study further revealed the frequency of renal masses which was more in male (71.90%, n=151) as compared to female (28.09%, n=59). The study found that the right kidney was affected in 58.09% (n=122) of cases, the left kidney in 36.19% (n=76), and both kidneys in 5.71% (n=12). In our study, we observed variations in density among patients, with 39.06% exhibiting mixed density, followed by 23.80% with hypo-dense, 20.95% with hyper-dense, and 16.19% with iso-dense lesions. When it comes to enhancement, we found that 40.01% had a moderate degree, 24.76% had mild enhancement, 21.90% had intense enhancement, and 13.33% showed no enhancement.
Conclusion: In this study, we found a strong correlation between histopathological diagnosis and computed tomography (CT) in identifying solid renal masses, with notably high validity test results. Given these robust validity parameters, we can confidently conclude that CT scans serve as an effective and reliable diagnostic modality for identifying and diagnosing renal masses.
Keywords: CT Scan, Renal Mass, Radiology
Kidney masses can occur as one or more growths, impacting either one kidney or both. Non-cancerous masses encompass inflammatory issues and tumors.1 Many times, kidney masses are found by chance during imaging tests conducted for reasons unrelated to kidney concerns or symptoms. Individuals who are diagnosed incidentally with RCC, rather than those experiencing urologic symptoms related to RCC, tend to have a more favorable outlook. This suggests significant progress in the survival rates of RCC patients. A considerable part of this improvement is credited to the early radiologic identification of kidney malignancies, leading to a higher percentage of tumors that can be successfully treated through surgical removal. Consequently, the identification and precise diagnosis of renal masses stand as crucial responsibilities for radiologists.1
Cancerous kidney tissue growths can be either primary or secondary. Renal cell carcinoma (RCC) stands out as the most prevalent primary kidney cancer, making up approximately 86% of all primary cancerous kidney tissue growths. Secondary growths consist of malignant lymphoma and metastases.2 Renal cell carcinoma stands out as the most prevalent primary cancer affecting the kidney, constituting about 2% of all diagnosed cancers in humans. The exact cause of RCC remains unknown. However, certain factors increase the risk, including a history of dialysis, a family history of the disease, high blood pressure, having a horseshoe kidney, Polycystic Kidney Diseases, smoking, and Von Hippel Lindau disease. Despite extensive research and advancements in the treatment of renal cell carcinoma, the disease remains notably resistant to radiation therapy and chemotherapy. Sadly, only 5-10% of individuals diagnosed with RCC may survive beyond five years.3 Navigating renal tumor imaging presents not just the task of distinguishing between benign and malignant lesions reliably but also involves accurately outlining the full extent of the disease. This precision is essential to ensure optimal planning for effective treatment.4,5 Ultrasonography is often the initial phase in evaluating renal masses, primarily focusing on revealing and portrayal. If a renal mass shows signs of having a solid component, further characterization usually involves CT or MRI.6
CT is a swift, user-friendly, and safe investigative imaging method that offers valuable insights into a broad range of renal disorders. It proves highly accurate in discerning the nature and extent of renal masses.2 The introduction of Spiral CT has notably enhanced the imaging of renal masses. This improvement is attributed to its ability to reduce volume averaging artifacts and facilitate image acquisitions during optimal contrast enhancement.5 To ensure a precise identification of a disease, the chosen modality must be effective. Even with extensive research, studies have consistently shown that renal cell carcinoma (RCC) remains resistant to both radiotherapy and chemotherapy. Even in surgical resection, the 5-year survival rate for patients with metastatic RCC is only 5-10% in some cases. Early detection of RCC becomes crucial for improving the prognosis and survival of patients.7-10
In this context, a CT scan emerges as the preferred imaging choice. It not only provides vital information to radiologists but also serves as a guiding tool for planning surgery. The aim of this study is to assess the role of CT for diagnosing renal masses in Pakistani adults.
This was a population based cross-sectional study that was conducted at the Department of Radiology, PESSI Hospital, Islamabad, from July 2022 to June 2023. Confidence interval was set as 95% with error of margin 5%. In order to achieve 95% confidence interval, the sample size calculated as 180 but we assessed 220 suspected renal mass cases referred to radiology department, to make our results more accurate. Each patient underwent computed tomography for radiological diagnosis. The follow-up extended until post-operative tissue diagnosis, allowing for histopathological comparison. However, four patients declined to undergo surgery, two more refused fine-needle aspiration cytology (FNAC), and histopathology reports for three patients were unavailable. Consequently, the final study population comprised 210 patients.
Diagnostic standards: The CT diagnosis of various renal tumors is based on followings:
TCC (Transitional Cell Carcinoma)
- In a pre-contrast CT, Transitional Cell Carcinoma presents as an indistinct mass, appearing hypodense in structure compared to the normal renal parenchyma (with a density value ranging between 8 and 30 HU).
- Following intravenous contrast, TCC tends to show poor development due to its lower vascularity.
- When TCC permeates the renal parenchyma, its thickness and development may resemble that of renal cell carcinoma.
- There might be accompanying features such as hydronephrosis or hydrocalyx.
- In a pre-contrast CT scan, RCC manifests as a mass lesion that is hyperdense, isodense, or hypodense in relation to the normal renal parenchyma. The lesion typically displays an irregular or lobulated border.
- Following intravenous contrast insertion, most renal cell carcinomas exhibit enhancement, although to a smaller magnitude than the normal renal parenchyma. Heterogeneous enhancement is every so often observed, attributed to tumor necrosis or hemorrhage.
- RCC commonly involves incursion into the renal vein or the inferior vena cava (IVC).
- The detection of fat on CT scans is highly indicative of angiomyolipoma.
- CT imaging will reveal the presence of fat in over 90% of cases, exhibiting regions with low density (20 HU or less).
- Non-fatty sections of the lesion display intense vascularity, showcasing significant enhancement with intravenous contrast.
- The characteristics of kidney metastases closely resemble those observed in renal cell carcinoma (RCC).
- Occasionally, there is widespread penetration causing the destruction of the normal style, resulting in imaging features that closely resemble those seen in infiltrating Transitional Cell Carcinoma (TCC).
The mean age of the study participants was 48.00±810 years. Male to female ratio was 2:1. The majority of the study participants were belonging from the urban area and were under graduate. The results are shown in figure 1.
Figure 1: Demographic Characteristics of the Study Cohort
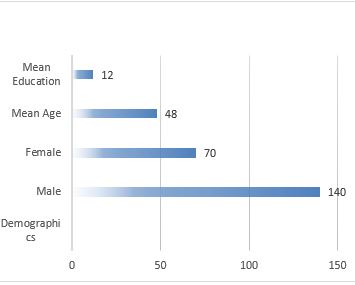
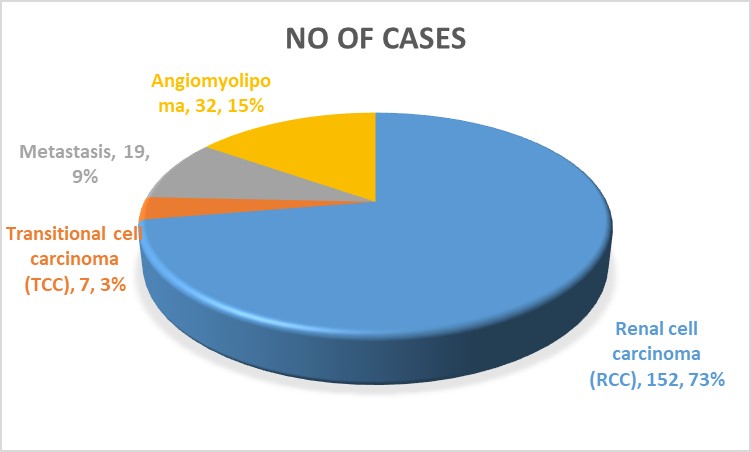
Figure 2: Study’s cohort distribution according to the diagnosis of CT
Table I: Patient’s distribution according to features of Pre-contrast CT |
|||
Pre-contrast CT Characters |
Status |
Study Participants |
%age |
Lesion’s Thickness |
Mixed |
82 |
39.06 |
|
Hyper-dense |
44 |
20.95 |
|
Hypo-dense |
50 |
23.80 |
|
Iso-dense |
34 |
16.19 |
Lesion’s Size |
Large |
66 |
31.44 |
|
Medium |
92 |
43.80 |
|
Small |
52 |
24.76 |
Lesion’s Margins |
Poorly defined |
128 |
60.95 |
|
Well defined |
82 |
39.05 |
Calcification |
Absent |
160 |
76.19 |
|
Present |
50 |
23.81 |
Table II: Patient’s distribution according to features of Post-contrast CT |
|||
Post-contrast CT Characters |
Status |
Study Participant |
%age |
Enhancement Nature |
No enhancement |
28 |
13.33 |
|
Homogenous |
88 |
41.90 |
|
Heterogeneous |
94 |
44.77 |
Enhancement Degree |
No enhancement |
28 |
13.33 |
|
Intense |
46 |
21.90 |
|
Moderate |
84 |
40.01 |
|
Mild |
52 |
24.76 |
Neighboring immersion |
Incursion |
NA |
NA |
|
Renal Vein |
6 |
2.85 |
Table III: Patient’s distribution according to CT diagnosis of RCC with Histopathological diagnosis |
|||
CT Diagnosis |
Histopathological Diagnosis |
Total |
|
|
RCC |
Non-RCC |
|
RCC |
150 (TP) |
8 (FP) |
158 |
Non-RCC |
8 (FN) |
44 (TN) |
52 |
Total |
158 |
52 |
210 |
According to the post-contrast CT features, the distribution of study population is given in table II. The results of the CT diagnosis of RCC with the histopathological diagnosis are mentioned in table 3. Patient’s distribution according to CT diagnosis of TCC, metastasis, Angiomyolipoma and renal mass with Histopathological diagnosis is mentioned in table 4.
The mean age of the study participants was 48.00±810 years. Hamood7 presented a range of ages spanning from 20 to 70 years, with the average age being 50 years old. The age group that appeared to be more engaged was between 50 and 59 years old, closely resembling the demographic in the current study.
In our investigation, we noticed a higher prevalence of renal mass in male participants, with 71.90% of patients being male and 28.09% being female. The male-to-female ratio was 2:1, a finding that closely aligns with the studies conducted by Lagerveld et al.8 and Curry et al.,9 where they reported male percentages of 69.6% and 75%, respectively. The study found that the right kidney was affected in 58.09% (n=122) of cases, the left kidney in 36.19% (n=76), and both kidneys in 5.71% (n=12). Likewise, Lagerveld and colleagues8 discovered that the distribution of renal masses in the right and left kidneys was 56.8% and 43.2%, respectively.
Table IV: Patient’s distribution according to CT diagnosis of TCC, metastasis, Angiomyolipoma and renal mass with Histopathological diagnosis |
|||
CT Diagnosis |
Histopathological Diagnosis |
Total |
|
|
TCC |
Non-TCC |
|
TCC |
10 (TP) |
2 (FP) |
12 |
Non-TCC |
2 (FN) |
196 (TN) |
198 |
Total |
12 |
198 |
210 |
CT Diagnosis |
Histopathological Diagnosis |
Total |
|
|
Metastasis |
Non-metastasis |
|
Metastasis |
42 (TP) |
14 (FP) |
56 |
Non-metastasis |
2 (FN) |
152 (TN) |
154 |
Total |
44 |
166 |
210 |
CT Diagnosis |
Histopathological Diagnosis |
Total |
|
|
Angiomyolipoma |
Non-Angiomyolipoma |
|
Angiomyolipoma |
20 (TP) |
14 (FP) |
34 |
Non- Angiomyolipoma |
18 (FN) |
158 (TN) |
176 |
Total |
38 |
172 |
210 |
CT Diagnosis |
Histopathological Diagnosis |
Total |
|
|
Malignant |
Benign |
|
Malignant |
50 (TP) |
24 (FP) |
74 |
Benign |
56 (FN) |
80(TN) |
136 |
Total |
106 |
124 |
210 |
In our study, we observed variations in density among patients, with 39.06% exhibiting mixed density, followed by 23.80% with hypo-dense, 20.95% with hyper-dense, and 16.19% with iso-dense lesions. When it comes to enhancement, we found that 40.01% had a moderate degree, 24.76% had mild enhancement, 21.90% had intense enhancement, and 13.33% showed no enhancement. This aligns with Gerst et al.'s findings,10 where 73.9% exhibited mild to moderate enhancement, mirroring our current study.
Analyzing the nature of enhancement in our series, we noted that 41.90% displayed homogeneous enhancement, 44.77% exhibited heterogeneous enhancement, and 13.33% showed no enhancement. Additionally, only 2.8% of cases showed incursion of the renal vein. These results differ from Kim et al., study,11,12 where homogeneous enhancement was commonly observed in 69%. In this study, the CT diagnosis revealed that 152 cases (73%) were identified as renal cell carcinoma (RCC), 7 cases (3%) as transitional cell carcinoma (TCC), 19 cases (9%) as metastasis, and 32 cases (15%) as angiomyolipoma. Upon histopathological examination, our study found that 152 cases (73%) were identified as renal cell carcinoma (RCC), 7 cases (3%) as transitional cell carcinoma (TCC), 19 cases (9%) as metastasis, and 32 cases (15%) as angiomyolipoma. Notably, all renal masses biopsied during surgery were histologically classified using the criteria established by Lagerveld and colleagues8 in their study, revealing 64 cases (83%) as renal cortical cancers and 13 cases (17%) as benign lesions. In the comparison between CT for diagnosing Transitional Cell Carcinoma (TCC)and histopathology, our present study revealed robust validity test results. The positive predictive value, accuracy, specificity, sensitivity and negative predictive value were all found to be 100%. This suggests a high level of reliability in distinguishing TCC using these diagnostic methods.
In a study by Raza et al.13, the diagnostic accuracy for intra-renal TCCs was also notable, with a sensitivity and specificity of 90%. The global assessment showed a range of 0.80-0.95, indicating moderate-to-excellent inter-observer agreement (k= 0.72-1). Pearle et al.14 reported in their study that the sensitivity and specificity of CT in detecting TCC were 100% and 62%, respectively. This aligns closely with the findings of our present study, indicating consistency in the diagnostic performance of CT for TCC. When comparing CT for diagnosing metastasis with histopathology, we found positive predictive value (80%), accuracy (97.8%), sensitivity (100%), specificity (98%) and negative predictive value were 100 respectively. In contrast, Jadvar et al.15 examined the diagnostic performance of CT in detecting renal metastasis and reported a sensitivity of 71%, specificity of 75%, accuracy of 72%, NPV of 33%, and PPV of 94%. In the comparison between CT for diagnosing angiomyolipoma with histopathology, the validity test results indicated positive predictive value (85.7%), accuracy (94%), sensitivity (75%), specificity (97.6%) and negative predictive value (95.3%). In a study by Zardawi16, the diagnostic performance metrics for angiomyolipoma were reported sensitivity as 92.5%, specificity as 91.9%, accuracy as 89.9%, positive predictive value as 94% and negative predictive value as 94% respectively.
The participants for this study were drawn from a single hospital in Islamabad, and the research was conducted over a relatively brief period. The study's limitation includes a small sample size, which may impact the generalizability of the results to the broader context of the country. Despite these constraints, it's noteworthy that the histopathological diagnosis of renal masses in this study exhibited a strong correlation with computed tomography (CT) diagnosis, and the validity test results were notably high.
Taking into account these robust validity parameters, it can be concluded that CT scanning proves to be an effective modality for diagnosing renal masses. However, it's important to acknowledge the study's limitations and consider them when interpreting the findings in the broader context of the country's healthcare landscape.
- Kabala JE. ‘The Kidneys and Ureters’, in Sutton D. (ed.), Textbook of Radiology and Imaging, Elsevier, Churchill Livingstone, 2003, pp. 929-987.
- Bhatt S & Dogra VS. ‘Kidney’, In Hagga JR, Dogra VS, Forsting M, Gilkeson RC, Ha HK & Sundaram M (eds.), CT and MRI of the whole body, Mosby, Philadelphia, 2009, pp. 1863-1952.
- Ronald J, Zagoria. ‘Imaging of small renal masses’, AJR 2000, vol. 175, no. 4, pp. 945- 946. pp. 1863-1952. https://doi.org/10.2214/ajr.175.4.1750945
- Chen YB. Renal cell carcinoma, U.S. National Library of Medicine, 2013
- Sheath S, Scatarige JC, Horton KM, Corl F, Elliot K & Fishman.Current Concept in the diagnosis and management of RCC: Role of multidetector CT and 3DCT, 2001, viewed on 2013. http://radiographics.rsna.org/content/21/suppl_1/S237.abstract.full
- Kim SH, Cho JY, Moon KC, Kwak C & Kim HH. USG evaluation of Renal Masses; Grayscale, Doppler and More 2013. < www. sciencedirect. com/ science / article/ pii/ S1556858X13000790>viewed October 2013. http://dx.doi.org/10.1016/j.cult.2013.07.002
- Hamood HQ. ‘Computed Tomography Performance in Renal Cystic Disease’, The Iraqi Postgraduate Medical Journal 2009;8(4):368-373.
- Lagerveld BW, van Dekken H, van Leenders GJLH & van der Zee JA. ‘The Role of pathology in Small Renal Mass Laparoscopic Cryoablation’, Advances in Urology, 2012;539648,: 6. https://doi.org/10.1155/2012/539648
- Curry NS, Cochran ST & Bissada NK. Cystic Renal Masses: Accurate Bosniak Classification Requires Adequate Renal CT. AJR 2000;175(2):339-342. https://doi.org/10.2214/ajr.175.2.1750339
- Gerst S, Hann LE, Duan Li, Gonen M, Tickoo S, Sohn MJ & Russo P.‘Evaluation of Renal Masses With Contrast-Enhanced Ultrasound: Initial Experience’, AJR 2011, vol. 197, no. 4, pp. 897–906. https://doi.org/10.2214%2FAJR.10.6330
- Kim JK, Kim TK, Ahn HJ, Kim CS, Kim KR & Cho KS.‘Differentiation of Subtypes of Renal Cell Carcinoma on Helical CT Scans’, AJR 2002;178:1499-1506.
- Catalano C, Fraioli F, Laghi A, Napoli A, Pediconi F & Danti M. High-resolution multi detector CT in the preoperative evaluation of patients with renal cell carcinoma’, AJR 2003;180(5):1271-1277. https://doi.org/10.2214/ajr.180.5.1801271
- Raza SA, Sohaib SA, Sahdev A, Bharwani N, Heenan S, Verma H & Patel U. Centrally infiltrating renal masses on CT: differentiating intrarenal transitional cell carcinoma from centrally located renal cell carcinoma’, AJR 2012;198(4):846-853.
- Pearle MS, Watamull LM, Mullican MA. Sensitivity of Non contrast Helical Computerized Tomography and Plain Film Radiography Compared to Flexible Nephroscopy for Detecting Residual Fragments After Percutaneous Nephrostolithotomy. J Urol 1999; 162:23- 26.
- Jadvar H, Kherbache HM, Pinski JK & Conti PS.‘Author information Diagnostic role of [F18]-FDG positron emission tomography in restaging renal cell carcinoma’, Clin Nephrol 2003, vol. 60 no. 6, pp. 395-400. https://doi.org/10.5414/cnp60395
- Zardawi IM. Renal fine needle aspiration cytology. Acta Cytol. 1999;43(2):184-90. http://doi: 10.1159/000330974.

An Official Publication of
Islamabad Medical & Dental College
Volume 13 Issue 1
Address of Correspondence
Naushaba Malik
Email:
doctor.Noshi100@gmail.com
Authors’ Contribution: 1,2Conception; Literature research; manuscript design and drafting; 2 Critical analysis and manuscript review; 2Data analysis; Manuscript Editing.
Cite this article. Malik N, Aftab S, Noor R. A Cross-Sectional Study on the Use of Computed Tomography Scan for Diagnosing Renal Masses in Pakistani Adults. J Islamabad Med Dental Coll. 2024; 13(1): 94-100. DOI: https://doi.org/10.35787/jimdc.v13i1.1125