Correlation of Low Back Pain with Pathological Changes of Lumbar Spinal Segment in Young Adults: A Cross-Sectional Study
Mamoona Shoukat1, Shamaila Ejaz2, Nausheen Raza1, Fariha Ahmad3, Ammara Ghafoor1, Nadia Ahmad1
1Sharif Medical & Dental College, Lahore, 2Lahore Medical & Dental College, Lahore, 3Capital Diagnostic Center, Islamabad,
Objective: To determine the association of low back pain in young adults with the spinal level most likely involved, based on MRI findings of their lumbar spinal segment.
Methodology: This cross-sectional study was conducted on 120 adults aged 25 to 40 years with low back pain. Lumbar spinal Magnetic Resonance Imaging (MRI) of these subjects was collected from Capital Diagnostic Center, Islamabad. Patients with any trauma, spinal surgery or fracture, active malignancy, metabolic bone disease, rheumatoid arthritis or pregnancy were excluded from the study. Disc and non-disc related parameters were evaluated from L1- L5 spinal levels. Further, gender-based differences in magnetic resonance imaging findings were also assessed.
Results: All the adults with low back pain showed some degree of disc degeneration on Pfirrmann grading system. The disc related MRI findings were more prevalent at lower lumbar spine levels L4-5 & L5-S1. No significant difference in spinal level was found between males and females upon comparison. However, it was revealed that males mostly had asymmetrical disc bulge (p = 0.03), while females predominantly exhibited facet joint involvement (p = 0.005).
Conclusion: In young adults with low back pain, lower lumbar spinal levels were predominantly involved. Disc degeneration was commonly observed in these lower lumbar spinal levels, with no apparent gender difference. However, other underlying factors contributing to low back pain may vary between males and females.
Keywords: Disc Degeneration, Intervertebral Disc, Lumbar spine, Low back pain, MRI, Young adults
Low back pain (LBP) being very common, has a significant economic toll on health care system. Any pain within the area starting from ribcage to gluteal folds is labeled as LBP. LBP is known to affect 70-85% of populace at some point in their lives.1 The source of this pain can be axial lumbosacral, radicular or referred.2 In axial lumbosacral, many disc related factors like disc herniation, high intensity zone, disc degeneration and non-disc related factors like thecal sac changes, neural foramina stenosis, vertebral body height changes have been observed.3 Degenerative diseases that include wear and tear of intervertebral discs have been mostly associated with low back pain.4 It has been estimated that almost 3.63% of the world population is affected by low back pain which is due to degenerative disease.5 Lumbar disc degeneration is considered as primary disability throughout the world, especially in industrialized countries.4 The differentiation of disc degeneration from other causes of low back pain is totally dependent on diagnostic tools such as computed tomography (CT) and magnetic resonance imaging (MRI) that help to clarify the anatomy of lumbar region.6 Globally, many population-based studies have been conducted to determine an association of LBP with MRI spine related changes, but results are controversial. The majority of research conducted in Pakistan focused on the age related and professional based causes of LBP.7,8 A study conducted in Pakistan reported disc desiccation as the most common MRI finding in patients with LBP, aged 20-75 years.9 The data on causes of LBP in adults with no history of trauma is scarce and need to be investigated. Therefore, this study was conducted to determine the frequency and MRI patterns of LBP in Islamabad.
In this cross-sectional study, demographics, history of LBP and MRI of 120 young adults with low back pain in the age range of 25-40 years were collected from Capital Diagnostic Center, Islamabad from March – June 2023 after ethical approval [Ref CDC#0000780/29/11/2022]. The adults with history of any trauma, back surgery, spine fracture, active malignancy, metabolic bone disease, rheumatoid arthritis, pregnancy, patients having normal MRI were excluded from this study. Lumbar MRI was done using Hitachi 0.3 Tesla open MRI.5- Multiplanar and multi sequential images were taken. MRI of the subjects was studied for disc related findings (Disc bulge, disc degeneration score, protrusion, reduced disc height and annular fissure) and non-disc related MRI findings (nerve root compression, thickness of Ligamentum flavum, facet joint involvement). Lumbar Disc degeneration grading was done using Pfirrmann grading system. T2 W sagittal sections of MRI were visualized to assess and grade the intervertebral disc from Grade I – V for any change in signal intensity and disc height 10. Data analysis was done using Statistical Package for Social Sciences (IBM SPSS version 23).
For quantitative parameters, mean and standard deviation was calculated and percentages and frequencies were calculated for qualitative parameters. The gender- based difference of MRI findings and comparison with low back pain was assessed by logistic regression analysis. P-value less than 0.05 was considered statistically significant.
Out of total 120 patients who came with low back pain without any history of trauma, 72 (60%) were male and 48 (40%) were females. The duration of low back pain ranged from minimum 2 weeks to maximum 16 weeks with a median duration of 6 weeks. 73 (60.8%) adults gave history of continuous back pain and 82 (68.3%) were having pain aggravation on walking (Table I).
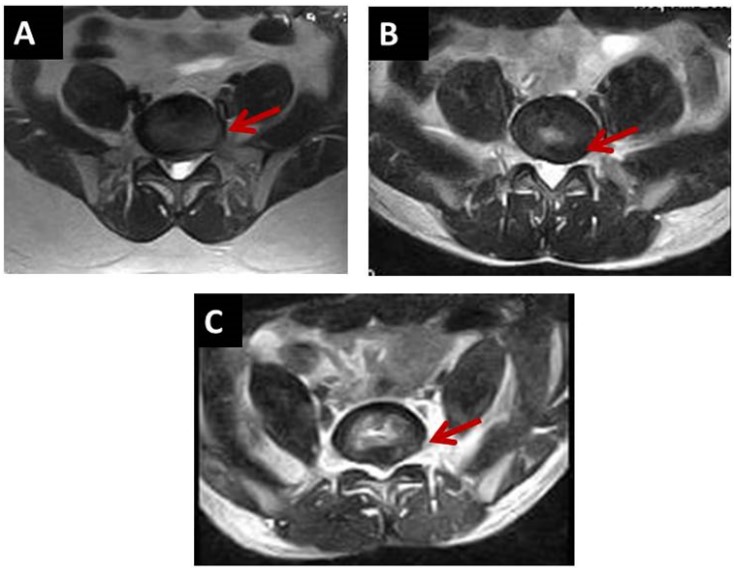
Figure 1: T2 Weighted images of MRI in transverse section showing A) Diffuse disc bulge B) Asymmetrical disc bulge C) Protrusion
Table 1: Demographic and clinical profile of patients with low back pain |
||
Parameters |
Total subjects (n=120) |
|
|
Mean ± SD |
|
Age |
35.5 ±3.55 |
|
|
n (%) |
|
Gender |
Male |
72 (60) |
Female |
48 (40) |
|
Low back pain |
Continuous |
73 (61) |
Intermittent |
47 (39) |
|
Aggravation of pain on |
Walking |
82 (68.3) |
Prolonged standing |
15 (12.5) |
|
Lifting some object |
30 (25) |
|
Prolonged sitting |
28 (23.3) |
|
Bending to one side |
22 (18.3) |
|
Significant MRI findings were at lower lumbar level (L4-5 & L5-S1). The frequency of disc related factors was higher than non-disc related ones. Disc related changes were seen at all lumbar spine levels.

Figure 2: Sagittal view of T2 weighted MRI showing different grades of disc degeneration A) Grade 3 at L5-S1 spinal level B) Grade 3 at L5- S1 with spinal stenosis C) Grade 4
Pfirrmann grading showed that 78 patients (65%) had grade 2 disc degeneration, which is more prevalent at L4-5 spinal level. Almost 78 (65%) adults had symmetrical disc bulge with 41 (52.5%) at L5-S1 level (Figure 1 & 2).
The non-disc findings were only seen at lower lumbar levels and mostly were having Ligamentum flavum thickness. MRI changes were higher in males as compared to females except facet joint involvement. Using a logistic regression analysis, it was found that females had 6.767 times more likelihood of facet joint involvement as compared to males which was statistically significant (P =0.005). MRI findings of asymmetrical disc bulge were significantly associated with males (P =0.037) (Table II). Table III shows the disc and non-disc related MRI findings at all lumbar spinal levels.
Table II: Gender based difference in MRI findings |
|||||
MRI findings |
Male |
Female |
Odds ratio |
CI (95%) |
P-value |
Asymmetrical disc bulge |
20 (83.3) |
4 (16.7) |
0.272 |
0.08-.923 |
0.037* |
Symmetrical disc bulge |
50 (64.1) |
28 (35.9) |
0.655 |
0.264-1.62 |
0.362 |
Protrusion |
20 (62.5) |
12 (37.5) |
0.922 |
0.359-2.37 |
0.86 |
Reduced disc height |
6 (60) |
4 (40) |
0.947 |
0.214-4.19 |
0.94 |
Annular fissure |
14 (66.7) |
7 (33.3) |
0.501 |
0.148-1.70 |
0.26 |
Nerve root compression |
6 (75) |
2 (25) |
0.497 |
0.077-3.22 |
0.46 |
Ligamentum flavum thickness |
27 (73) |
10 (27) |
0.570 |
0.225-1.44 |
0.23 |
Facet joint involvement |
4 (23.5) |
13 (76.5) |
6.767 |
1.79-25.57 |
0.005* |
Table III: Frequencies and percentages of disc and non-disc related MRI findings at all spinal levels |
|||||||||
Parameters |
Total |
Lumbar spinal levels |
|||||||
L1-2 |
L2-3 |
L3-4 |
L4-5 |
L5-S1 |
|||||
Disc related MRI findings |
|||||||||
Disc bulge |
Asymmetrical |
20 (16.6) |
1 (5) |
- |
1 (5) |
7 (35) |
11 (55) |
||
Symmetrical |
78 (65) |
- |
- |
3 (3.8) |
25 (32) |
41 (52.5) |
|||
Disc degener-ation score |
Grade 1 |
13 (11) |
- |
- |
- |
5 (38.4) |
8 (61.5) |
||
Grade 2 |
78 (65) |
2 (2.5) |
5 (6.4) |
11 (14.1) |
45 (57.6) |
15 (19.2) |
|||
Grade 3 |
22 (18.3) |
- |
2 (9) |
5 (22.7) |
10 (45.4) |
5 (22.7) |
|||
Grade 4 |
7 (5.8) |
- |
1 (14.2) |
1 (14.2) |
2 (28.5) |
3 (42.8) |
|||
Protrusion |
32 (26.6) |
- |
- |
- |
19 (63.3) |
13 (43.3) |
|||
Reduced disc height |
10 (8.3) |
- |
- |
- |
- |
10 (100) |
|||
Annular fissure |
21 (17.5) |
- |
1 (4.7) |
1 (4.7) |
7 (33.3) |
8 (38) |
|||
Non-Disc related MRI findings |
|||||||||
Nerve root compression |
8 (6.6) |
- |
- |
- |
6 (75) |
2 (25) |
|||
Thickness of Ligamentum flavum |
37 (30) |
- |
- |
- |
27 (73) |
10 (27) |
|||
Facet joint involvement |
17 (14.1) |
- |
- |
- |
15 (76.4) |
4 (23.5) |
|||
In this study, the most promising finding was the presence of reduced disc signals mostly reported at lower lumbar spinal levels representing disc degeneration grade 2 in all the subjects. Asymmetrical disc bulge was mostly present at lower lumbar spinal levels. Disc related factors were more responsible for disc degeneration than non-disc related factors. Another study has described similar findings about involvement of neural-immune mechanism in protrusion and disc bulging.11 The current study revealed that degeneration involved all the lumbar spine levels. The probable reason was explained by another study which showed that degeneration which starts in one joint might affect other joints of the same intervertebral level.12 There are multiple factors including immune genes (including ZBTB16, MSH2, HEBP2 and ADAM8) that might have a role in affecting multiple levels of lumbar spine in degeneration. These genes alter the immune pathway and myeloid cells leading to disc degeneration and spondylosis.13 Reduced disc height and symmetrical disc bulge was present mostly at L4-L5 level and most of the patients were classified as grade 2 Pfirrmann. These results coincide with the study done in Poland by Pekala et al where maximum cadavers showed grade 2 intervertebral disc degeneration.14 Grade 2 intervertebral disc degeneration indicates that it is moderate in severity with preserved disc height.15 The upper levels of lumbar spine L1-2, L2-3 and L3-4 only showed reduced disc signals and were totally spared from non-disc related MRI findings. Non disc findings were only observed at lower lumbar level. These findings were in accordance with Sudhir et al., who reported that higher Pfirrmann grades increase ligamentum flavum hypertrophy, resulting in decreased disc height. Various inflammatory factors might contribute in increasing the thickness of ligamentum flavum e.g IL-1. These interlukins cause nerve excitation and might be involved in the degradation of collagen fibers, leading to fibrosis.16
The collection of MRI data from a single center and the small sample size are major limitations of this study. However, this single-center, population-based study may help to exclude other diseases and causes of degenerative disease, thereby guiding surgeons in early treatment of low back pain in young adults.
The study showed that while all patients exhibited disc degeneration, the most commonly affected level was L4-L5 with grade 2 Pfirrmann classification. Disc-related MRI findings were more prevalent than non-disc-related degenerative changes. The contributing factors to low back pain differ between males and females.
- De Souza IMB, Sakaguchi TF, Yuan SLK, Matsutani LA, do Espírito-Santo AdS, Pereira CAdB, et al. Prevalence of low back pain in the elderly population: a systematic review. Clinics. (Sao Paulo). 2019 Oct 28;74:e789. https://doi.org/10.6061/clinics/2019/e789
- Urits I, Burshtein A, Sharma M, Testa L, Gold PA, Orhurhu V, et al. Low back pain, a comprehensive review: pathophysiology, diagnosis, and treatment. Curr Pain Headache Rep. 2019;23:1-10. https://doi.org/10.1007/s11916-019-0757-1
- Khaliq A, Gilani SA, Malik A, Anjum MN, Bacha R, Chaudhry UR. Spectrum of Magnetic Resonance Imaging Findings in Patients with Low Back Pain. Pak J Physical Therapy. 2018:12-8.
- Saleem S, Aslam HM, Rehmani MA, Raees A, Alvi AA, Ashraf J. Lumbar disc degenerative disease: disc degeneration symptoms and magnetic resonance image findings. Asian Spine J. 2013 Dec;7(4):322-34. https://doi.org/10.4184%2Fasj.2013.7.4.322
- Ravindra VM, Senglaub SS, Rattani A, Dewan MC, Härtl R, Bisson E, et al. Degenerative lumbar spine disease: estimating global incidence and worldwide volume. Global Spine J. 2018;8(8):784-94. https://doi.org/10.1177/2192568218770769
- Cunha C, Silva AJ, Pereira P, Vaz R, Gonçalves RM, Barbosa MA. The inflammatory response in the regression of lumbar disc herniation. Arthritis Res Ther. 2018;20:1-9. https://doi.org/10.1186%2Fs13075-018-1743-4
- Javed S, Dawood MH, Memon MW, Selod IZ, Seja A. Prevalence of low back pain among medical doctors of the teaching hospitals in Karachi, Pakistan: A cross-sectional survey. SAGE Open Med. 2023 Mar 18;11:20503121231157217. https://doi.org/10.1177/20503121231157217
- Ijaz M, Akram M, Ahmad SR, Mirza K, Ali Nadeem F, Thygerson SM. Risk Factors Associated with the Prevalence of Upper and Lower Back Pain in Male Underground Coal Miners in Punjab, Pakistan. Int J Environ Res Public Health. 2020 Jun 9;17(11):4102. https://doi.org/10.3390%2Fijerph17114102
- Nazia Azeem, Muhammad Anwar, Malik Osama Tanweer. (2022). Clinical Importance of MRI Lumbar Spine in Lower Backache. Pakistan Journal of Medical & Health Sciences, 16(08), 57. https://doi.org/10.53350/pjmhs2216857
- Pfirrmann CW, Metzdorf A, Zanetti M, Hodler J, Boos N. Magnetic resonance classification of lumbar intervertebral disc degeneration. Spine J. 2001;26(17):1873-8. https://doi.org/10.1097/00007632-200109010-00011
- Ye F, Lyu FJ, Wang H, Zheng Z. The involvement of immune system in intervertebral disc herniation and degeneration. JOR spine. 2022;5(1):e1196. https://doi.org/10.1002%2Fjsp2.1196
- Yong-Hing K, Kirkaldy-Willis WH. The pathophysiology of degenerative disease of the lumbar spine. Orthop Clin North Am. 1983;14(3):491-504. https://doi.org/10.1016/S0030-5898(20)31329-8
- 13. Hai, B., Song, Q., Du, C. et al. Comprehensive bioinformatics analyses reveal immune genes responsible for altered immune microenvironment in intervertebral disc degeneration. Mol Genet Genomics 297, 1229–1242 (2022). https://doi.org/10.1007/s00438-022-01912-3
- Pękala P, Taterra D, Krupa K, Paziewski M, Wojciechowski W, Konopka T, et al. Correlation of morphological and radiological characteristics of degenerative disc disease in lumbar spine: a cadaveric study. Folia Morphol. 2022;81(2):503-9. https://doi.org/10.5603/fm.a2021.0040
- Foizer GA, Paiva VCd, Nascimento RDd, Gorios C, Cliquet Júnior A, Miranda JBd. Is there any association between the severity of disc degeneration and low back pain? Rev Bras Ortop 2022;57:334-40. https://doi.org/10.1055/s-0041-1735831
- Wang AY, Saini H, Tingen JN, Sharma V, Flores A, Liu D, et al. The relationship between wild-type transthyretin amyloid load and ligamentum flavum thickness in lumbar stenosis patients. World Neurosurg. 2022;164:e113-e8. https://doi.org/10.1016/j.wneu.2022.04.008

An Official Publication of
Islamabad Medical & Dental College
Volume 13 Issue 2
Address of Correspondence
Shamaila Ejaz
Email:
sijaz47@gmail.com
Authors’ Contribution: 1,2Conception; Literature research; manuscript design and drafting; 3,4 Critical analysis and manuscript review; 5,6Data analysis; Manuscript Editing.
Cite this article. Shoukat M, Ejaz S, Raza N, Ahmad F, Ghafoor A, Ahmad N. Correlation of Low Back Pain with Pathological Changes of Lumbar Spinal Segment in Young Adults; a Cross-Sectional Study. J Islamabad Med Dental Coll. 2024; 13(2): 271-276.
DOI: https://doi.org/10.35787/jimdc.v13i2.1111